Having described the study and procedure last week in Part I for this most recent online blind test, let's continue by looking into the results from the 67 unique respondents. For this post, we will focus on the "objective" results based on the data. As I have done in previous tests, in a follow-up post, we'll have a look at the "subjective" descriptions of what respondents perceived.
We'll start as usual with some context into the respondents' demographics, we'll then proceed to examine the sound systems used by the respondents, and from there, look at their blind listening submission results to see if harmonic distortion correlated with preferences around perceived "better" or "worse" sound quality...
Part I: Respondent Demographics
It's important to make sure we start with some context around characteristics of the respondents themselves. Geographically, I asked respondents to tell us which continent they are testing from:

As you can see, for this test, most of the responses are from Europe followed by N. America. This is very similar to the distribution with last year's blind test comparing different DAC/players. Great to see some participants from Asia, Australia, and Africa as well. Thank you particularly to the Europeans!
As for gender distribution, we do have one woman participant:

Age wise, here's the distribution, showing an expected range:

All participants were adults >20 years old. Median age would be in the 51-60 group. I think this age distribution is not unexpected for the audiophile community although given the fact that this is a digital audio test, perhaps the age distribution might be even a little bit younger than what one might see at audio shows drawing an even broader range of hobbyists.
Finally, here are the subgroups of listeners with background experience in sound production, musicians, and audiophile hardware reviewers:

As with previous blind tests, we can focus on these subgroups a little later to see if there were special preferences within them even though there are small numbers in each group.
Part II: Systems Used for Evaluation
I like this part because it gives me a peek at the kinds of systems blog readers listen with :-).Let's consider the price tag of what listeners used:

Looks like we have a broad selection of equipment here from a few inexpensive <US$200 systems to aspirational gear >US$100,000. The median system is in the $2,000-$5,000 range - a realistic price for the average audiophile playing hi-res digital audio these days. As you can see, there were a good number of $10,000-$20,000 systems in the mix. Perhaps fewer systems in the $5,000-$10,000 category than I would have thought.
Respondents used both speakers and headphones - in this study about 1/2 used loudspeakers only:

Great to see that about a quarter of respondents used both headphones and speaker systems which I think is a nice indicator of the extra effort by a number of listeners.
As for the equipment used, here is a list - approximately in the order that the submissions came in with links to either prices where available or company descriptions of the products:
Speakers: Yamaha HS8, ELAC FS409, B&W 802 Diamond, Scansonic MK-5, YG Acoustics Carmel, Ino Audio Pip, B&W 704 S2 + DB3D Sub, Fyne F500, KEF 102/2, SVS PB12 sub, Emotiva Airmotiv 6s, Magico M2, Quad ESL 57, DIY speakers based on Diatone 610 drivers, KEF Reference Model One, Linkwitz LX521.4, B&W 706 S2, Definitive SM-45, Rowen A12, KEF 105/3 + SVS SB-2000 Pro, Harbeth P3ESR, Usher Mini Dancer 2, Magico S3 MkII, Linkwitz LXmini+2, ProAc DT 8, Kaiser Chiara, JK Acoustics Optima IV, PMC IB2i, ELAC FS407, Focal Alpha 50, ELAC B6, PreSonus Eris E4.5, ProAc D40R, ATC SCM 40, Precide Oskar Kithara w/ Heil AMT, REL sub, ADAM A5X, KEF Blade, Jamo C803 + C80Sub
Headphones: HIFIMAN HE560, Focal Clear, Logitech G633, Focal Utopia, Sennheiser Momentum, Sennheiser HD660, Beyerdynamic DT1990, AKG K702, Grado SR80, Sony MDR-7506, Stax SR-009S, Sony WH-1000XM3 (wired mode), Apple Earpods!, Audio-Technica ATH-M50, PSB M4U, LZ-A4 IEM, Audio-Technica ATH-M50x, Etymotic ER4SR, Audio-Technica ATH-M40x, NAD Viso HP50, Cardas EM5813, AKG K701, Beyerdynamic DT 990 Pro, Sennheiser CX1.00, Sennheiser HD555, Sony MDR-V6, Sennheiser HD650, 1MORE Quad Driver, STAX SR-009, Beyerdynamic DT1350
DACs: Apogee Element 24, Focusrite Scarlett 2i2, Schiit Modi 3, Audio-GD, MSB Diamond DAC IV, Eximus DP1, Chord Qutest, NAD M51, Weiss DAC502, Oppo BDP-105, Lumin X1, RME ADI-2 Pro, Marantz CD6006, AUNE S16, SMSL SU-8, Bluesound, PS Audio Perfect Wave II, Khadas Tone Board, Behringer Xenyx UFX1204 console, Soekris dac1541, Cambridge CXN, Mytek Stereo 192, Mytek Liberty DAC (with KECES P3 power supply), Focusrite 2i4, Raspberry Pi 3B+ with IQaudIO Pi-DAC+, Music Hall DAC15.2, Schiit Modi 2 Uber, RME UFX II, Oppo UDP-205, Komplete Audio 2, LKS Audio MH-DA004, Schiit Gungnir multibit, Grace SDAC balanced, Topping D30, Creative AE-5
Amps: Devialet Expert 210 Pro, Classe CA-M400 monoblocks, Mark Levinson 27.5, Blue Circle Audio BC28, Mark Levinson 23.5, Benchmark AHB2, Naim Uniti Atom, PrimaLuna Prologue Two, Parasound HCA855, Devialet Expert Pro 440, Mitchell Alecto monoblocks, Elekit tube amp with 6v6GT, Cambridge Audio CXR120, Nord Hypex nCore, Naim 5SI, PS Audio C250, ICEPower 125ASX2, DA&T A38, Electrocompaniet, Devialet Expert 400, Yamaha RX-V1700, Parasound Halo A23, Devialet 1000 Pro, JK Acoustics Active '65', Bryston 4B SST2, Mytek Brooklyn AMP, McIntosh MC225, Marantz MM8003, Yamaha MX-1, Accuphase E-350, Yamaha R-N500, Peachtree nova220SE, Hypex nCore NC500
Headphone Amps/DAPs: Drop + THX AAA 789, Arcam rHead, Fiio K5 Pro, JDS Labs Atom, Stax SRM-T8000, Cozoy Takt C, iFi iDSD, Chord Mojo, Fiio K3, Burson Conductor SL, Oppo HA-2, Audioquest Dragonfly Black, Echobox Explorer, Schiit Magni 2 Uber
Preamps/Others: iMac, Classe Delta CP-700 Preamp, Uptone Iso Regen, Schiit Eitr, MacBook Pro, MiniDSP 2x4HD, Chromecast Audio, Marantz AVR 6012 (as pre), Trinnov Altitude 16, Emotiva XSP-1, miniDSP SHD Studio, Aurender, Raspberry Pi + HifiBerry Digi+, Cocktail Audio N15D, Bluesound Vault 2, Rowen Absolute Pre, SOTM tX-USBexp, JK Acoustics Pre, Bluesounds Node 2, Synology NAS, Akitika PR-101, SOtM sMS-200Ultra Neo
Cables, Filters, Power products mentioned: Acoustic Zen Hologram II, PS Audio P5 power plant, iFi iSilencer 3.0, Lavricable Ultimate Silver Dual USB-Kabel, Kimber XLR, Kimber 8VS speaker cables, Pangea power cables, Dynavox X6000, Gordian Lab 12, Chord C RCA interconnects, Kimber 4PR, Mutec MC-3+USB, Mutec REF10
Whew! Nice variety. For those who submitted, I trust you see your gear listed in there...
A few listeners had DIY preamps and amplifiers. Many used Roon-based systems, others JRiver, some foobar, I see one person using VLC to run the test. I haven't looked at the descriptive comments yet but I know there were some detailed observations offered. A couple of submissions used complex upsampling like HQPlayer.
Certainly some very interesting set-ups out there with components I had not heard of until reviewing the submissions. Over the years of doing this, I've been noticing an increase in ELAC speakers in use along with more acceptance of Class D amplification (a number of people were using unspecified Hypex and ICEPower parts in DIY builds). Also, I counted at least 4 respondents using the JDS Atom headphone amp which seems like a popular head-fi choice these days.
While this broad range of hardware might be seen as a limitation, to me this is fine because the intent of this little study is to perform a "naturalistic", "real world" evaluation of the audibility of harmonic distortion in the "wild" rather than meant to be some kind of lab exercise where we only pick certain hardware, or certain listeners. My interest is not so much about "What is the threshold of THD discrimination?", but rather "Does higher THD make a difference among audiophile listeners at home?".
Part III: The Results... Are harmonic distortions audible?
Let's ask some questions and interrogate the results to find answers...1. Looking at all 67 respondents, how did they rate the samples from "best" to "worst" sounding?

Right off the bat, combining the results of all respondents, we see that Sample D (-30dB/3%) which had the highest amount of harmonic distortion added was ranked "worst" sounding (highest average score since 1=best, 4=worst). The -50dB/0.3% sample was rated as sounding "better". Interestingly, there was a small preference for the -75dB/0.02%) THD sample over the essentially untouched -175dB/0.0000002% sample.
Remember that this is the "raw" data without any filtering performed. In previous blind tests, I know that if a person is unable to hear a difference, they will leave the response as A-B-C-D, hence biasing Sample D as being "worst" by nature of the order. What we need to do now is start looking deeper.
2. How audible were the differences between the tracks?
When the respondents were asked to evaluate to what extent they were able to hear differences, this is how they responded:

As you can see, 30% thought the differences heard between the samples were either "huge" or "big". 52% thought the difference was "small" or "very little". And 18% felt they perceived no difference at all. This in itself I find to be useful information. Considering that up to 3% THD was added, it's interesting to note that almost 20% of people felt they heard no difference. Remember that this is an A/B listening test where listeners are free to quickly switch from one track to another likely within seconds; much quicker and easier than switching cables or devices and trying to remember what was heard - yet a significant number could not hear a difference still.
I had a look at the 12 respondents who felt there was "no difference" to see if this correlated with equipment price:

The systems covered a broad price range. I don't think the data clearly points to lower prices relating to less ability to hear differences. Interesting to see that within this group included respondents who owned more expensive systems >$10,000, even one respondent with a $75k-$100k system indicated he heard no difference.
As for the age distribution of those who did not hear a difference:

3. If we exclude those that were unable to hear a difference between tracks, what was the ranking between "best" to "worst" sounding samples?
Doing this will bring the total sample size down to 55 respondents. Check this out:

The moment we took away that "no difference heard" group, it seems like those who felt they could hear a difference were still able to rank the lower THD samples (0.02% and 0.0000002%) as sounding "better" compared to 0.3% and 3% sounding "worse".
Again, considering only those who felt they heard a difference, we can count the individual "votes" and see from "best" (1) to "worst" (4) how the respondents felt about each Sample. If the results were random, we would expect to count 13-14 in each category. Based on this expectation, we can statistically assess the observed outcome:

I ran a χ² statistic of the results for each of the Samples above. As you can see, the only "signal" that comes out as significant is that of a preference (p<0.05) for Sample C (-75dB/0.02% THD). As shown in the graph, many respondents thought this sample sounded "best" and few thought it sounded "worst" to the point where this distribution appeared to be <5% due to chance alone.
I'm not sure that I can explain this but will discuss a couple of possibilities in Part IV.
4. Was there a difference depending on the age of the listener?
Let's now look at the difference in pattern between those 20-40 years old, compared to the 41+ age group:

BTW, you might be wondering what kind of gear the younger folks who felt they could hear a difference used:

Perhaps not unexpectedly, younger listeners are tending towards less expensive systems. There was however one younger fella who splurged and took home that >$100,000 super-system!

Compared to the total group of respondents, those <41 y.o. also tended to perform more headphone-only testing (38% vs. 28% for all respondents). This of course leads us to the next question...
5. Did headphone vs. speaker listening make a difference?

Yes it did! Notice that it was the "speaker only" group that did not rank the 3% THD sample as sounding "worst". The headphone users seemed to be best able to tease out the 3% distortion sample and those who used both speakers and headphones followed with a similar pattern as the "headphone only" group but the preference was not as strong.
6. Of those who did not feel their preference necessarily correlated with THD, how did they rank the samples?
When I designed this study and in my discussions with Paul K, the author of Distort, we wondered if there were participants who believed that their subjective preferences would not correlate with distortion amount. This is why I put in question 11 in the survey: "Do you believe that your choice of "BEST" (1) to "WORST" (4) sound quality ranking correlates with LOWEST to HIGHEST harmonic distortion added?" If they did not, then I allowed them to re-rank the samples based on what they thought represented the lowest to highest harmonic distortion.
In total, excluding those who "heard no difference", 13% (7/55) felt their subjective preference did not correlate with distortion amount and provided an alternate ranking:

Impressive group of 7 here! Though small, this is the first subgroup so far, on average, able to rank the samples in the correct order from lowest to highest distortion added. Nice insight. It seems like this small group recognized that sometimes a little bit of distortion may be subjectively preferable.
Looking at the profiles of these 7 men, their ages ranged from "21-30" up to "61-70" with no special distribution. They used a broad range of systems with prices from <$200(!) headphone listening up to $20k-50k speaker systems. I did not see any particular preference for headphones/speakers/both.
There were slightly more musicians in this group (57% vs. 45% for the total group). Not necessarily significant given such a small sample of course.
7. Which song/music passage differentiated the samples the most?

Of all the respondents who felt they could hear a difference, 18% did not feel they had a track preference. 27% felt that they could hear the most difference with the Hootie & The Blowfish track "Tootie", followed by Lang Lang's "Hungarian Rhapsody No. 6" piano/classical track with 24%.
8. Did the subgroup of audio engineers, musicians, and audio hardware reviewers perform differently?
As usual, it's nice to pick out the folks who might have special skills based on experience/vocation to see if they performed differently on the test. Again, I excluded those who "heard no difference". Here are the preferences of self-identified musicians, audio engineers, and hardware reviewers:

9. For those who felt the difference was "huge" or "big" (30%, n=20), how did they rank the "best" to "worst" sounding samples?
Up to now, notice that I mainly analyzed the groups excluding those who could hear "no difference". What if we paid attention now to the respondents on the other extreme - the ones who seemed more confident that they actually could hear a difference?

I wondered if this result adds some credibility to the idea that just like 18% of respondents were unable to detect a difference, perhaps there is a subgroup of individuals more sensitive to hearing harmonic distortions and in this study was able to show that indeed they could as a group pick out the highest distortion track more easily.
Notice that the ranking looks a bit like the "younger" <40 y.o. subgroup in (4). However, the age distribution actually shows these listeners to be on the whole older:

Perhaps there is something to be said about experience being beneficial even if ultimately we can't fight the effects of age and change to hearing acuity? :-)
10. How many "Golden Ears" were there in this blind test?
In total there were 5 respondents who selected the order "correctly" from lowest distortion ("best") to highest distortion ("worst"). Statistically there are 4! = 24 potential combinations which means that out of 55 respondents who "heard a difference", we would expect 2-3 based on pure chance alone.
Looking at demographics and systems these individuals used, the "Golden Ears" were interestingly not in the "younger" group of respondents - all of them ranged from 41-70 years old. The sound systems ranged from $200-500 on the low end up to $75k-100k. They believed that their ranking of "best" to "worst" sounding correlated with higher THD.
The "Golden Ears" came from all over the world - US, Singapore, Sweden, Switzerland, and Portugal. 3/5 were musicians or have had musical performance experience.
Good show, boys!
Part IV: In Summary...
As you can see above in Part III, there are many sub-analyses we can look at to explore correlations. Let's now summarize the main "take home" points from this study.1. As with my other "Internet Blind Tests", this is an open, "naturalistic" survey targeted at audiophiles listening from home or on their computers from a wide range of demographic backgrounds with broad range of equipment used. While I cannot obviously ensure that playback and testing were done properly, from the responses provided, I believe that on the whole, the respondents used good equipment and I can see that they took significant effort to provide feedback with many detailed descriptions of what they heard (to be published next time).
The audibility of the distortions added will therefore depend on the reproduction quality and perceptual abilities of the persons performing the test. Since all audio systems will have a base level of distortion and noise, audible differences suggest that the amounts applied to the test samples must be above what is inherent in those playback systems and hearing threshold of the listeners.
2. Even though a significant amount of distortion - up to 3% THD - was added to the musical samples, hearing a difference between the files was not a "slam dunk". In total, 67 respondents submitted their listening impressions, and 18% felt they could not hear a difference at all. Note that this 18% likely is an underestimate since "negative reports" are often under-represented in studies. I suspect some who took the test and could not hear a difference probably also did not bother filling out the survey. Of the remaining 55 respondents who felt they could hear a difference, 30% felt the difference was "huge" or "big". The majority, 52% felt that audible differences were "small" or subtle at best.
3. Excluding the 18% (12 respondents) who reported hearing no difference, I suspect that as a group, the remaining 55 respondents did appear to have the ability to differentiate lower vs. higher harmonic distortion.
To illustrate, suppose we lumped the "Hi" THD samples (3% & 0.3%) and "Lo" THD samples (0.02% & 0.0000002%) together and looked at how respondents rated the sound quality from "best" (1) to "worst" (4) sounding, we see this pattern:

This is a mirror image graph showing "Hi" distortion samples achieving the fewest "best" sounding ratings and the highest number of "worst" sounding votes, and vice versa for the "Lo" distortion samples - more listeners thought that lower distortion samples sounded "best". Statistically, this kind of pattern has a p value of 0.061; not strictly p<0.05, but low likelihood of being just purely random.
4. Remember that hearing ability is non-linear. There is a "floor" to how much detail we can perceive plus there are psychological and psychoacoustic effects that might not be obvious. This might be why many respondents actually preferred the -75dB/0.02% THD sample over the -175dB/0.0000002% "control" samples. Perhaps they just couldn't tell the difference because Sample C (-75dB/0.02%) sounded good and followed B (-175dB/0.0000002%), Sample C was selected as "best" due to position of the options.
In my discussions with Paul K (Distort, DeltaWave), another intriguing possibility for the Sample C (-75dB/0.02% THD) preference was the idea of an "euphonic" effect from the 2nd and 3rd harmonics which were set at -70dB when I created the samples. The remaining higher order harmonics at -80dB or less might be below the hearing threshold so would not have resulted in any unpleasant effect unlike with the -50dB and -30dB samples where these higher order harmonics are much stronger. In contrast, the -175dB sample did not have this euphonic component in its favour. Interesting hypothesis, perhaps made stronger by the results of those 7 respondents in Part III.6. This can be teased out if we run another blind test examining preferences for low vs. high order harmonics of equivalent magnitude! (Anyone up for yet another blind test!? :-)
Non-linear perceptual limitations potentially struck again with the -30dB/3% THD sample being rated as "better" sounding than -50dB/0.3% for a number of listeners. Perhaps the respondents were able to experience that the 0.3% THD sample wasn't the "best" sounding of the options but clearly the 3% THD sample didn't sound 10x worse!
5. Based on the observations, it would not be unreasonable to suggest that the threshold for audibility is somewhere in that "Hi" and "Lo" THD divide between -75dB/0.02% and -50dB/0.3%. Somewhere in there is the "shift" where the THD is high enough that the bias turns negative against the perceived sound quality as a group.
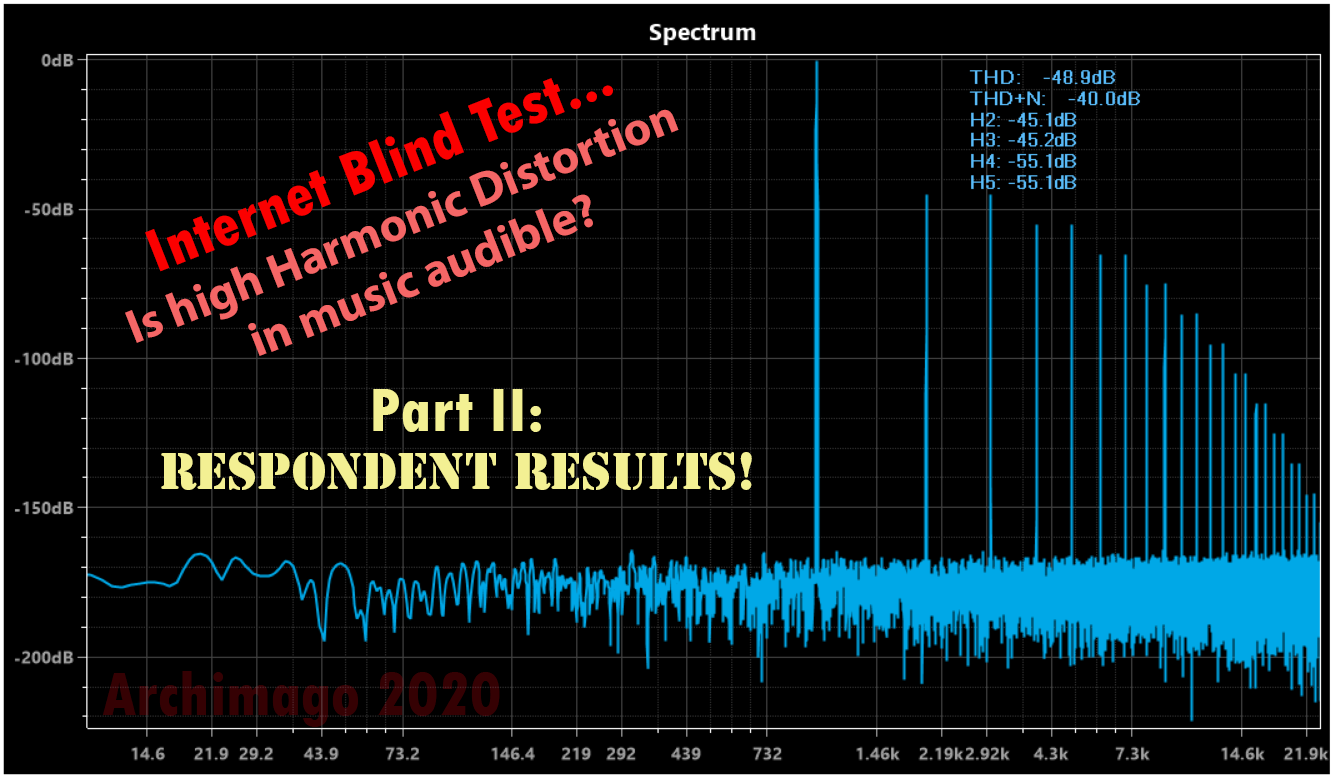
For a visual reminder, here are the 0.02% and 0.3% THD graphs with a typical 1kHz 0dBFS tone to show just how much distortion we're looking at!

It would be a very poor DAC these days to have worse harmonic distortion than even the -75dB/0.02% THD graph. Likewise, within a comfortable listening range, the majority of "good" amplifiers would be able to reproduce audio with less distortion than this paired with appropriately sensitive speakers/headphones. The only devices within a hi-fi system where distortion could be expected to have higher THD would be the transducers (speakers and headphones). But even then, THD will vary across frequencies and not necessarily to this level across the whole range.
It's possible that the reason I'm seeing the threshold around these levels is that this is the group threshold of audibility based on the systems people are using. Under more controlled "lab" conditions with very high-fidelity systems, it's possible (likely) that the absolute threshold of audibility for harmonic distortion would be even lower. I also expect audibility of THD would be easier with test tones rather than real music.
For now, I think that for music listening, if the THD of the reproduction system from source to speaker/headphone is <0.1% (-60dB) across the audible spectrum, the vast majority of listeners would not find this to be objectionable. One might even hear some preferred "euphonic distortion" with low order harmonics around the 0.01-0.1% THD range in my estimation (needs to be tested of course!).
Over the years, I have heard "subjective-only" audiophiles claim that "harmonic distortions don't matter" and that objective results "don't correlate to sound quality". These results suggest that they are wrong.
Looking at the results here, I believe the data supports the idea that in a blind test, of those who reported hearing sonic differences, lower harmonic distortion did correlated to "better" sound. I therefore see no reason why as rational audiophiles we should not persist in achieving better sound quality based on the concept of "high fidelity" which can be objectively verified. At the same time, remember what I said a year back about "good enough"... Even though we can see correlations between distortion level and preference, we don't need to be neurotic about insisting on owning DACs and amplifiers with vanishingly low THD either. Just as "extreme subjectivists" might erroneously claim measurements make no difference, we need not be "extreme objectivists" either thinking that a -120dB THD DAC "sounds better" than one at -100dB beyond just being able to appreciate the engineering efforts to achieve excellent performance!
The ear/brain system is quite remarkable for what it can perceive, but obviously the resolution is not infinite and our subjective sense of joy can be evoked whether through an AM radio or hi-fi system with favourite songs... In fact, there might even be that "euphonic distortion" factor showing up in these results suggesting that many audiophiles actually want a little bit of distortion after all - potentially quantifiable through group blind testing like this!
To the 67 brave souls who submitted themselves to this blind test - thank you for your valuable contribution gentlemen and lady! I appreciate your spirit and willingness to help, and in doing so, I believe you have assisted with promoting meaningful results-driven discussions rather than simply idiosyncratic opinions we already have plenty of in the audiophile niche (among other places).
------------------
To end this post, I think it's important to note that much of the audiophile press writers/reviewers do not perform controlled listening tests and seem to more often than not feel negatively about performing blind testing. Many complain that it's too "stressful" among various other dubious reasons. Who ever said that finding answers was meant to be easy or without complexities? Even when some post up little blind tests like this one from Michael Fremer using different phono cables recently, they don't seem to pay attention to controlling variables like amplitude of the files which IMO speaks poorly to the efforts. Without controlled listening, without measurement data, without confirmation of actual effects, almost any claim can be made regardless of how improbable - this is the weakness of purely subjective testimony.
I know it's not easy participating in blind listening tests in general. However, the results from them can be both educational and eye-opening (here's an interesting list of summary results from a blog in 2010). The reality of the situation I believe is that there are few true "Golden Ears" regardless of what you might read in the press or online with people claiming to hear "obvious" or "clear" differences between otherwise "high fidelity" gear that measure well (or simply improbable claims like fancy cables or power products). In 2020, in general, I believe engineered products that measure well across a range of standard tests will sound vastly more alike than different regardless of asking price.
I believe what is needed are group efforts like those presented above if we are to tease out audible differences and find correlations that help inform "what's best" with some power based on the evidence. I wonder if audiophile hardware reviewers - John Atkinson, Robert Harley, Jim Austin, Herb Reichert, Michael Fremer, Jason V. Serinus, Andrew Quint, Michael Lavorgna, Lee Scoggins, John Darko, Alan Sircom, etc. - or outspoken industry people who grace the pages of magazines with various claims - Paul McGowan, Ted Smith, Ted Denney, Neil Young, Bob Stuart, etc. - were to take part in a blind test like the one above, what would be the outcome? Would they have been able to pick out the more distorted samples as perhaps sounding "worse"? Would there be high numbers of "Golden Ears" within that population using whatever "best" equipment they choose? Since testimonies are used to sell hardware, how much faith are we to put in claims especially when audiophile products and accessories are not uncommonly dubious?
As usual, I believe it's good to be skeptical of claims with no objective backing. Appropriately, this recent subjective-only review of what might be a broken, yet expensive and fancy looking, product with almost predictable superlative conclusions like "Without question, the ********** integrated amplifier delivered the finest class-D sound that I've ever heard in my system." by JVS with no published objective results in the pages of Stereophile has put the readership's "faith" on the line as suggested by the numerous comments.
-------------------
2020 will certainly be a year for the record books ladies and gentlemen. No doubt historians will look back at these days in the years ahead and try to contemplate the times, our thoughts, our decisions, and our actions. From health crisis, financial turmoil, to shifts in local and geopolitics, changes are afoot with more to come and repercussions that will resonate for years.
Stay healthy. Know what's right. Do good.
Enjoy the music...
Addendum - June 11, 2020:
As per the discussions in the comments, there was a question about the 16 "headphone-only" group of listeners. Here's some extra information about the subgroup:


As we can see, the headphone-only group had a range of ages but tended <61 years old. They did not have to spend much money to get the results :-). 7/16 (44%) had systems <US$500.
And finally the specific preference-ranked numbers based on each sample. Clearly the reason they performed well was because as a group they really did not like Sample D (-30dB/3%) and nobody thought Sample C (-75dB/0.02%) sounded "worst". Again, we're looking at small samples...
You are the hardest working man in Blogville. Very nice work. As with MF TT tests I often just normalize the files myself, but I also think that it makes me work harder to be honest with myself knowing that even a .1db difference can create a bias. It keeps me from trying to be "just right" rather than know what is "right". Lying to myself on tests does no one any good. Never worked in school either. I was pleased with MF's last test as I have a lot of HOSA cable in my studios.
ReplyDeleteHey Jim,
DeleteA man's gotta have his passions and for me if it's enjoyable and hopefully can add something of value, it's worth the effort :-). I don't intend to write audiophile posts indefinitely, but while I am doing it, let's give it a good effort!
Remember though that this test has been in the making since December 2019 in discussions with Paul K. Many ideas expressed here obviously have been percolating in my mind depending on where the data took me...
I think part of the "hardest working man" comment though is also a reflection of the audiophile hobby. If you look at the blogs and articles in other hobbies like the guys who measure lens sharpness in camera-land or computer gamers who test GPU performance, or a few years back when Tyll Hertsens was still running InnerFidelity, those articles also took lots of effort! It's just that audiophile blogs these days seem to contain little information or attempt to actually investigate things thoroughly.
Good that you took the effort to normalize the MF TT tests to 0.1dB. I suspect many people who try will not...
I sure miss Tyll as I am a big headphone user, meaning I use them a lot as I am only 5"8". lol Since he has left the site has not been the same.
DeleteI did write Steinway and asked for some technical lowdown on their streams and hope I hear back next week and I will surely share that into. If their quality was all I had to listen to I would be happy. I love classical piano music music. I was a baseball major, so I play poorly, but i did write this last night. I haven't slept well in two weeks with all that is going on. Off my google drive. https://drive.google.com/file/d/1U2wM235mUDXy4YY-lovJXl7h2wIvueP5/view?usp=sharing
Yeah InnerFidelity is unrecognizable. So is AudioStream even though I wasn't a big fan of Lavorgna's viewpoints and style of presentation :-).
DeleteTake care man and get some rest. Hopefully the world will find its footing again in the near future. I hope Steinway gets back to you around the quality of the stream. Will check out your writing...
Had a listen to your composition Jim... Beautiful. Well done!
DeleteThanks, that is kind of you. It keeps me out of bars and chasing wild women. lol When you get to be 73 you BETTER have a hobby. I was in hopes that with all the background acting my wife and I did for half of last year before covid-19, that some music compositions might take root, but now we are told that BG actors will not longer be used, so it was fun while it lasted. Diane was Kathy Bates; body double in Jewell and we are featured in The Conjuring 3 coming in the fall. I was to be featured in a March movie, but the other actors in CA did not come due to covid that that project was scrapped.
DeleteI enjoyed reading the results of your test. Going into it, I thought an overwhelming number of listeners would be able to identify the test level with the most distortion. Apparently, not so.
ReplyDeleteListening at this level is very hard work. The average music lover who has a knowledge of MP3 sound would have a hard time with this, as wood those who cannot hear the difference between the same music at 2496 or redbook CD quality. I am not indicting them it is just that it does not matter to them. You have to really care and challenge yourself to be a critical listener. As a former Math educator this is why the U.S. ranks 32nd in the world in Math ability as it is not about difficulty, but about being willing to put in the effort and wanting to learn. We have fallen from 21st in the world in 10 short years.
DeleteThe result pretty much conformed to my predictions. I said: "My prediction is that some people might be able to spot the -30 db THD samples as the most distorted, but it will not be easy (maybe barely getting past significance threshold). I think it is almost impossible to detect -50 db THD or less, so it and the -70 and -175 will get similar scores on average."
ReplyDeleteSo apparently spotting the difference between the two best ones and two worst ones is slightly easier than I thought, but still very few people actually got the whole thing right. The 3% sample trends towards being the worst the most, but it's far from totally conclusive. It's unsurprising that almost no one preferred the -175db over the -75db because that's where the threshold is probably is, and the speculated reasons given to why people put the -75db first sound reasonable.
Although the 3% was the most THD, it was put in first or second place 24 times. That's enough to show that the importance of THD is somewhat overrated, generally. It means that people CAN enjoy music with relatively high THD. It doesn't mean that it's preferred overall though, because -75db still scored best. So you will probably enjoy the music more with lower THD, but in the general scheme of things, it's not as important as some might think.
I agree that being an extreme objectivist is unproductive. The chase after ever increasing SINAD values like in ASR lead to rapidly diminishing returns. I think it's better to have THD\SINAD values that are just enough to assure audible transparency, and invest the remaining time and research to lower prices and improve reliability and functionality.
Absolutely Fluffy,
DeleteOne can definitely enjoy music even with rather high levels of harmonic distortion. As audiophiles, I would still target my interest towards higher performance, lower THD(+N)/high SINAD gear, but there's absolutely no reason for most sane, non-neurotic, non-audiophile types to care unless truly atrocious!
It's all about probabilities at this stage. Art, beauty, joy can still be served quite easily without major concerns with <0.1% THD gear IMO, which isn't a particularly high bar to overcome...
Excellent work. It makes me very happy that you didn't report "1.49% of respondents were female". ;-)
ReplyDeleteLOL Rob.
DeleteBTW, she has an excellent system and results were in line with the overall consensus but not quite the "Golden Ear" result!
Many thanks for this test and the perfect evaluation. As a participant I had a lot of fun to participate and play with my equipment to hear how THD works. I used both my loudspeaker and my headphones.
ReplyDeleteI found out for myself that I immediately recognized the example with the lowest THD (Sample B). Furthermore that I found this sample B the most pleasant. Samples A and D were almost equally unpleasant for me and then, as you've already guessed, I just took the order.
For me it would have been good if the test had come with a volume recommendation. The differences were more clearly audible above a certain volume.
You noticed that there were a lot of Elac speakers. I bought my Elacs (a total of 10 speakers in my system in a 7.1.2 configuration) because they are extremely linear and balanced, not only in my opinion. This also applies to other manufacturers in the list. I have the impression that most of the people who participated were people who like a sound profile that doesn't have or produce THD like tube amps.
It would be interesting to ask for the personal, subjective sound preference. This might explain the question of the preference for the slight distortion as a euphonic effect.
Interesting comment Ralph,
DeleteGood hearing man!
Yeah, tubes not popular within the listeners in this test. Would actually be quite interesting how that group might have responded. We might simply see less of a trend towards the "Lo distortion" samples simply because of a tendency towards higher THD with tube amplifiers/preamps.
Awesome, seems like you're having fun with the ELACs and thanks for taking the time to evaluate with both speakers and headphones!
That's exactly the question I'm left with after this magnificent study; do tube users have different results? They might have a preference for some THD, but on the other hand the high THD samples might be to much if their amp's already have high THD.
DeleteReally fascinating project, Arch.
ReplyDeleteAs usual, you provide a corrective to the subjective blather of the audio rags and also the extreme 'objectivism' of ASR, where differences below the -100dB level seem to be implicitly assumed as reflecting sound quality.
I think the move to express noise and distortion in dB rather than percentage is very positive. If we're listening to music peaking about 86dB in a room with a background noise level of about 35dB to speakers with a -50dB distortion, it seems more obvious that we probably won't hear any difference between 1% and .001% (to switch scales) in our preamps.
After taking the test, for my own interest, I ran the A and C files through audio diffmaker and then could see and listen to the distortion components... they were of course very low level, only poking above the noise floor on peaks. And they didn't correspond to anything I thought I had heard in the test. Now that I know the score, I'll try the same with B and D and listen with better phones.
Always looking forward to your posts. Keep it up, sir, you are a very rare source of thoughtful and balanced inquiry on what to me has always been a fascinating and rather mysterious subject. I've spent quite a bit of money (by my standards) over the years on products that initially promised game-changing improvements but ultimately and inevitably disappointed. My audio mantra now: Remember the green pen.
Keep well.
Thanks for the note Phil,
DeleteImportant point about the volume aspect which was also noted above by Fluffy about using a volume recommendation since certainly the reference level will affect audibility. I've been trying to use dB more with my amplifier measurements as well yet there's a sense of familiarity with %.
As a fellow Canadian with 3 major political parties here (4 if you include the Greens especially popular here in BC), I do find it particularly "Canadian" to remind folks that there are more than 2 ways to see the world :-).
Yeah... No need to be extreme anything IMO. Obviously we can subjectively *like* anything we want but still maintain a cool head about how things objectively *work* without resorting to bizarre attribution theories and cultish snake oil!
Cheers!
Great job Arch! I find it fascinating about the -75 dB preference. I did some listening tests a while back where I varied the bit depth and frequency response of a music sample and compared it to the original. The best I could do was around -72 dB or 12 bits of resolution. Here is a link to the article which also has the music samples that folks can download and try for themselves:
ReplyDeleteFun With Digital Audio – Bit Perfect Audibility Testing
It makes me wonder if 12 or 13 bits of resolution is at most folks audibility threshold and it is just a noticeable difference which triggers the preference. Also, I wonder if it does not matter if it were THD, IMD, bit depth, frequency response change, or any artifact of any kind, that this is the audibility threshold for most folks… Great work man, and looking forward to the rest of your analysis.
Kind regards,
Mitch
Hey thanks for the feedback Mitch,
DeleteYeah, right at the threshold! And as the guys above noted, depending on listening level, will affect audibility.
Beyond the threshold effect and the fact that I was unable to find a pattern towards many people liking higher distortion, what is most interesting now I think is the question of whether "euphonic distortion" is actually a "thing" among audiophiles at a lowish level - like between -60dB/0.1% and -80dB/0.01%. And also if there is clearly a preference between low-order (possibly 'good') vs. high-order ('bad') harmonics as has been the general belief among audiophiles.
Wondering if you or anyone has run across actual data on these questions/beliefs.
Hi Archmimago
ReplyDeletegreat work. Amazing that even -30 THD is not easy, by a few, or not at all identifiable by the most peaple (not counting the ones who did not the test may be because they could not identitfy).
In some earlier experiments I found that depending on the music, THD is easier to detect than in others. It may be due to the masking effect.
Easiest was in sinus-tones.
Now may I ask you to provide the settings (detailed) of the distort program. I would actually like to try some sinus-tones with exact your THD-levels and some musicfiles I know well.
I guess just copying your:
_DistortDefault.dw
would be enough (to the direcotry whetre the files now are, overwrite the default
and may be
_DistortDefault.dwr
On sinus-tones it would be interesting to see:
440Hz (Camber music tone)
220Hz (one octave deeper)
110Hz (two octaves deeper
880Hz (one octave higher)
1760 (two octave higher)
3520Hz (three octave higher)
Best regards
Peter
Hi Peter,
DeleteAbsolutely, here's a link to the 4 THD settings for Distort ZIP'ed together.
https://www.amazon.ca/clouddrive/share/TyttcCkUxZ1QVPJVrHSESMg2tOGotqrXTb05hYzyuI5
Enjoy and let me know your observations with the test tones!
Hi Archimago
Deletethere is a strange behaviour with Distort if I load your settings.
Error is:
System.NullReferenException: Object referenc not set at Wave.Distort.Form.txt....
Somehow last time despite the error I could produce a distorted file (tried around).
May be the settings are for a different Version of Distort than I am using.
I use Distort V1.0.19
The error pops up trying to load a source file or save a distorted file.
What version of Distort you are using?
A workaround is just to take you values, the values are in text-format in the settings file.
However its easiere to just load the file :)
Best regards
Peter
Hi Archinmago
ReplyDeleteThanks.
fist I had some troubles to use Distort.
I made only one quick try with a 440Hz sine at -30dB distortion.
I can't almost believe that the level of distortion is the same as in the musicfiles.
At -30dB distortion the sine-waves are easy to distinguish.
With music we know the result, very hard.
More to follow.
Best regards
Peter
Thanks for the update Peter,
DeleteYeah, huge difference when we go from test signals to the masking ability of complex music!
Have fun :-).
It is easy to see why redbook is fine for reproducing single test tones, but when you get to complex music, like symphonies with the hundreds and hundreds of frequencies and their harmonics, this is why more samples per second sounds better, easier to sort out the individual instruments and their positions in the mix. This is true even if the HF extension is beyond human hearing is it easily -100db down, but the higher tones and harmonics are better reproduced. If the original standard was 2496 and DVDs were the standard silver disc, we would be closer to perfect sound forever. We have come a long way and I am glad for it. No one even considered Jitter in the dawn of digital.
ReplyDeleteHi Jim,
DeleteNo doubt if at the dawn of digital audio, we had higher sample rates and bit-depth, we would have no need to question whether certain characteristics like filters might affect audibility and the like. I've always figured that 18-bits and maybe something like 50-60kHz would be plenty of headroom beyond what any human ear could differentiate even if one had marginal filters out at 25-30kHz and truncated bits without proper dithering down at the 18th bit.
However, I would wait and see what Mark Waldrep's final report looks like on his HD-Challenge II.
https://www.realhd-audio.com/?p=6713
My sense is that in 2020, 16/44.1 is pretty darn good already and practically, even if some can detect marginal/subtle differences between a true 24/96 recording and down-sampled to 16/44.1, this is not going to change how one is able to enjoy the music. We shall see...
Disclosure: I took an evening to blind-test 5 of Mark's tracks and submitted the results I think back in November/December 2019 using my ASUS Essence One DAC with Sony and Sennheiser headphones. Mark got back to me recently that I got 5/5 correct identifying the 24/96 tracks. Perhaps it was just my lucky night... But certainly from my own experience with blind testing "hi-res", I place little extra value on the need especially since true hi-res recordings are actually few and far between.
Hi
ReplyDeletethe guess, mi hypothis is now that complex music (dense music) masks highly distortion.
Thin music, in the extreme just one tone is more revealing...
This would mean music which has a lot of solo-parts is most critcal.
Dense music like hard-rock, big orchestras etc.less critical.
Would then be just opposite what Jim remarks.
Best regards
Peter
Yes, that has been my suspicion Peter,
DeleteI know that many audiophiles who listen to classical music have a strong preference and belief that orchestral recordings are the best source of music to determine resolution/fidelity. I don't know if this might be related to Harry Pearson's concept that the "absolute sound" came from performances of classical music in concert halls.
I find that classical is great for dynamics. There's also a lot of detail there, but I don't typically find large orchestral pieces to be the best if we're trying to listen for how resolving a system is. Smaller number of instruments, the purity of naturally recorded vocals, clean recordings of a piano with the nuances of the attack on the keys and natural decay of harmonics... I find these more useful to tease out good recordings and good playback.
I will investigate in this direction. Let you know.
ReplyDeleteBest regards
Peter
How do you account for the fact that many of these systems already have distortion well into the whole percent range without even adding more via the tracks? Especially the speaker systems, there is just so much variation. Many speakers have significant whole percent distortion which varies with volume of playback and frequency.
ReplyDeleteIf some has one has a higher distortion speaker it may cross the audibility threshold with the 3% track adding up to 5,6 or more percent depending vs someone who something like a revel system with nearly zero distortion by which the 3% track is still essentially 3% and may not yet be audibly distracting.
Hi
ReplyDeleteeither you know your Hifi chain including distortion or you must measure it.
Today there is pelnty ver high qualuty equipment with moderate prices as this test showed. Go only headphones if price is important.
Bestr Regards
Peter
When using headphones you will most probably have less background noise and no walls that the sound will bounce on. And it's also way cheaper to get a reference pair of headphones than a reference speaker system (with proper room acoustics). That's why headphone users score better :)
ReplyDeleteHi Archimago
ReplyDeleteI did now the series -30, -50, -75, -175dB distortion on a sine 440Hz.
Results:
-30, -50 is very easy to detect against pure (-300, -175dB)
-75 and -175dB have slightly different tonality like one is slightly higher tone than the other
Just a first quick test.
Test with foobar2000 ABX, DAC RME UFX II and Sennheiser HD800 Headphones
best regards
Peter
Interesting discussions Tell and Serge,
ReplyDeleteAs you can see, I've added a bit more information in the Addendum about the "Headphone-only" group of listeners including preference for each of the samples.
Hi Arch. I was thinking of adding my comments after part IV was published, but your addendum relating to headphones (of which I’m part) pushes me to comment right away. Like my headphones-only colleagues I found the worst case easy to detect because it seems to add something readily obvious over the music. Like many others, I was fooled into liking best the least distorted C sample for which I have a tentative explanation (for what it’s worth):
ReplyDeleteI mentioned in my questionaire that I found the tests well-chosen because they had all a character that could be mistaken as distortion: a female singer having some sibilance, a baritone with a grainy voice and slow bowing from Yo Yo Ma also having some grain. As for Lang Lang, he has a hard touch and those block chords stimulate the piano inharmonics a lot.
My choice was C A B D, Now when trying to order the last two middle choices, I put the undistorted B sample in third place, next to the worst… My explanation is that the undistorted version made me hear better those undesirable characters in the music, so I prefered the more euphonic C sample that masked them a little.
Thanks GillesP,
DeleteWill add more of a comment in the Part III post!
Archimago,
ReplyDeleteThanks for the work. I'm trying to work out the implications of your results for tube amplification.
I use Conrad Johnson Premier 12 tube monoblocks and have always had the impression they have a slight coloration that I enjoy. You can see the Stereophile measurements here:
https://www.stereophile.com/content/conrad-johnson-premier-twelve-monoblock-amplifier-measurements
Do have it right in thinking the distortion elements, impedance interactions with speakers, may well be in to the audible zone? (Depending on the speaker, of course). It sure sounds like it to me (and I enjoy it).
Teaching moment here... sorry. If there is no statistical significance, that means that you do not have enough power to conclude that there is a difference between distributions. You cannot say that there was no statistical significance, and then continue to compare the frequencies.
ReplyDeleteReporters make this mistake all the time with polling results. They say that candidate A is at 48%, and candidate B is at 51%. So candidate B is leading in the polls. They ignore the margin of error. If the margin is 3% or greater, we cannot say that either candidate is leading.
You generally found that there is no trustworthy difference between groups. Your test was unable to reveal difference. You can only draw conclusions where there were statistical differences.
Again, sorry to be so technical. I appreciate your work!
Hi Dr.Danger,
DeleteI see what you're saying. Many of the results were not statistically significant of course but there were trends which I think are worth noting and in doing so, perhaps point at results that were of interest even if one needed further testing with larger sample size. Also, even the concept of statistical significance as predefined has an element of convention to it. As audiophiles, we might not necessarily need to adhere to strict cut-offs.
Obviously this is not meant to be absolutely technically rigorous, but I think the results showed much more than the typical single-observer opinions...